Coral Cities: Kantar 2018 Submission

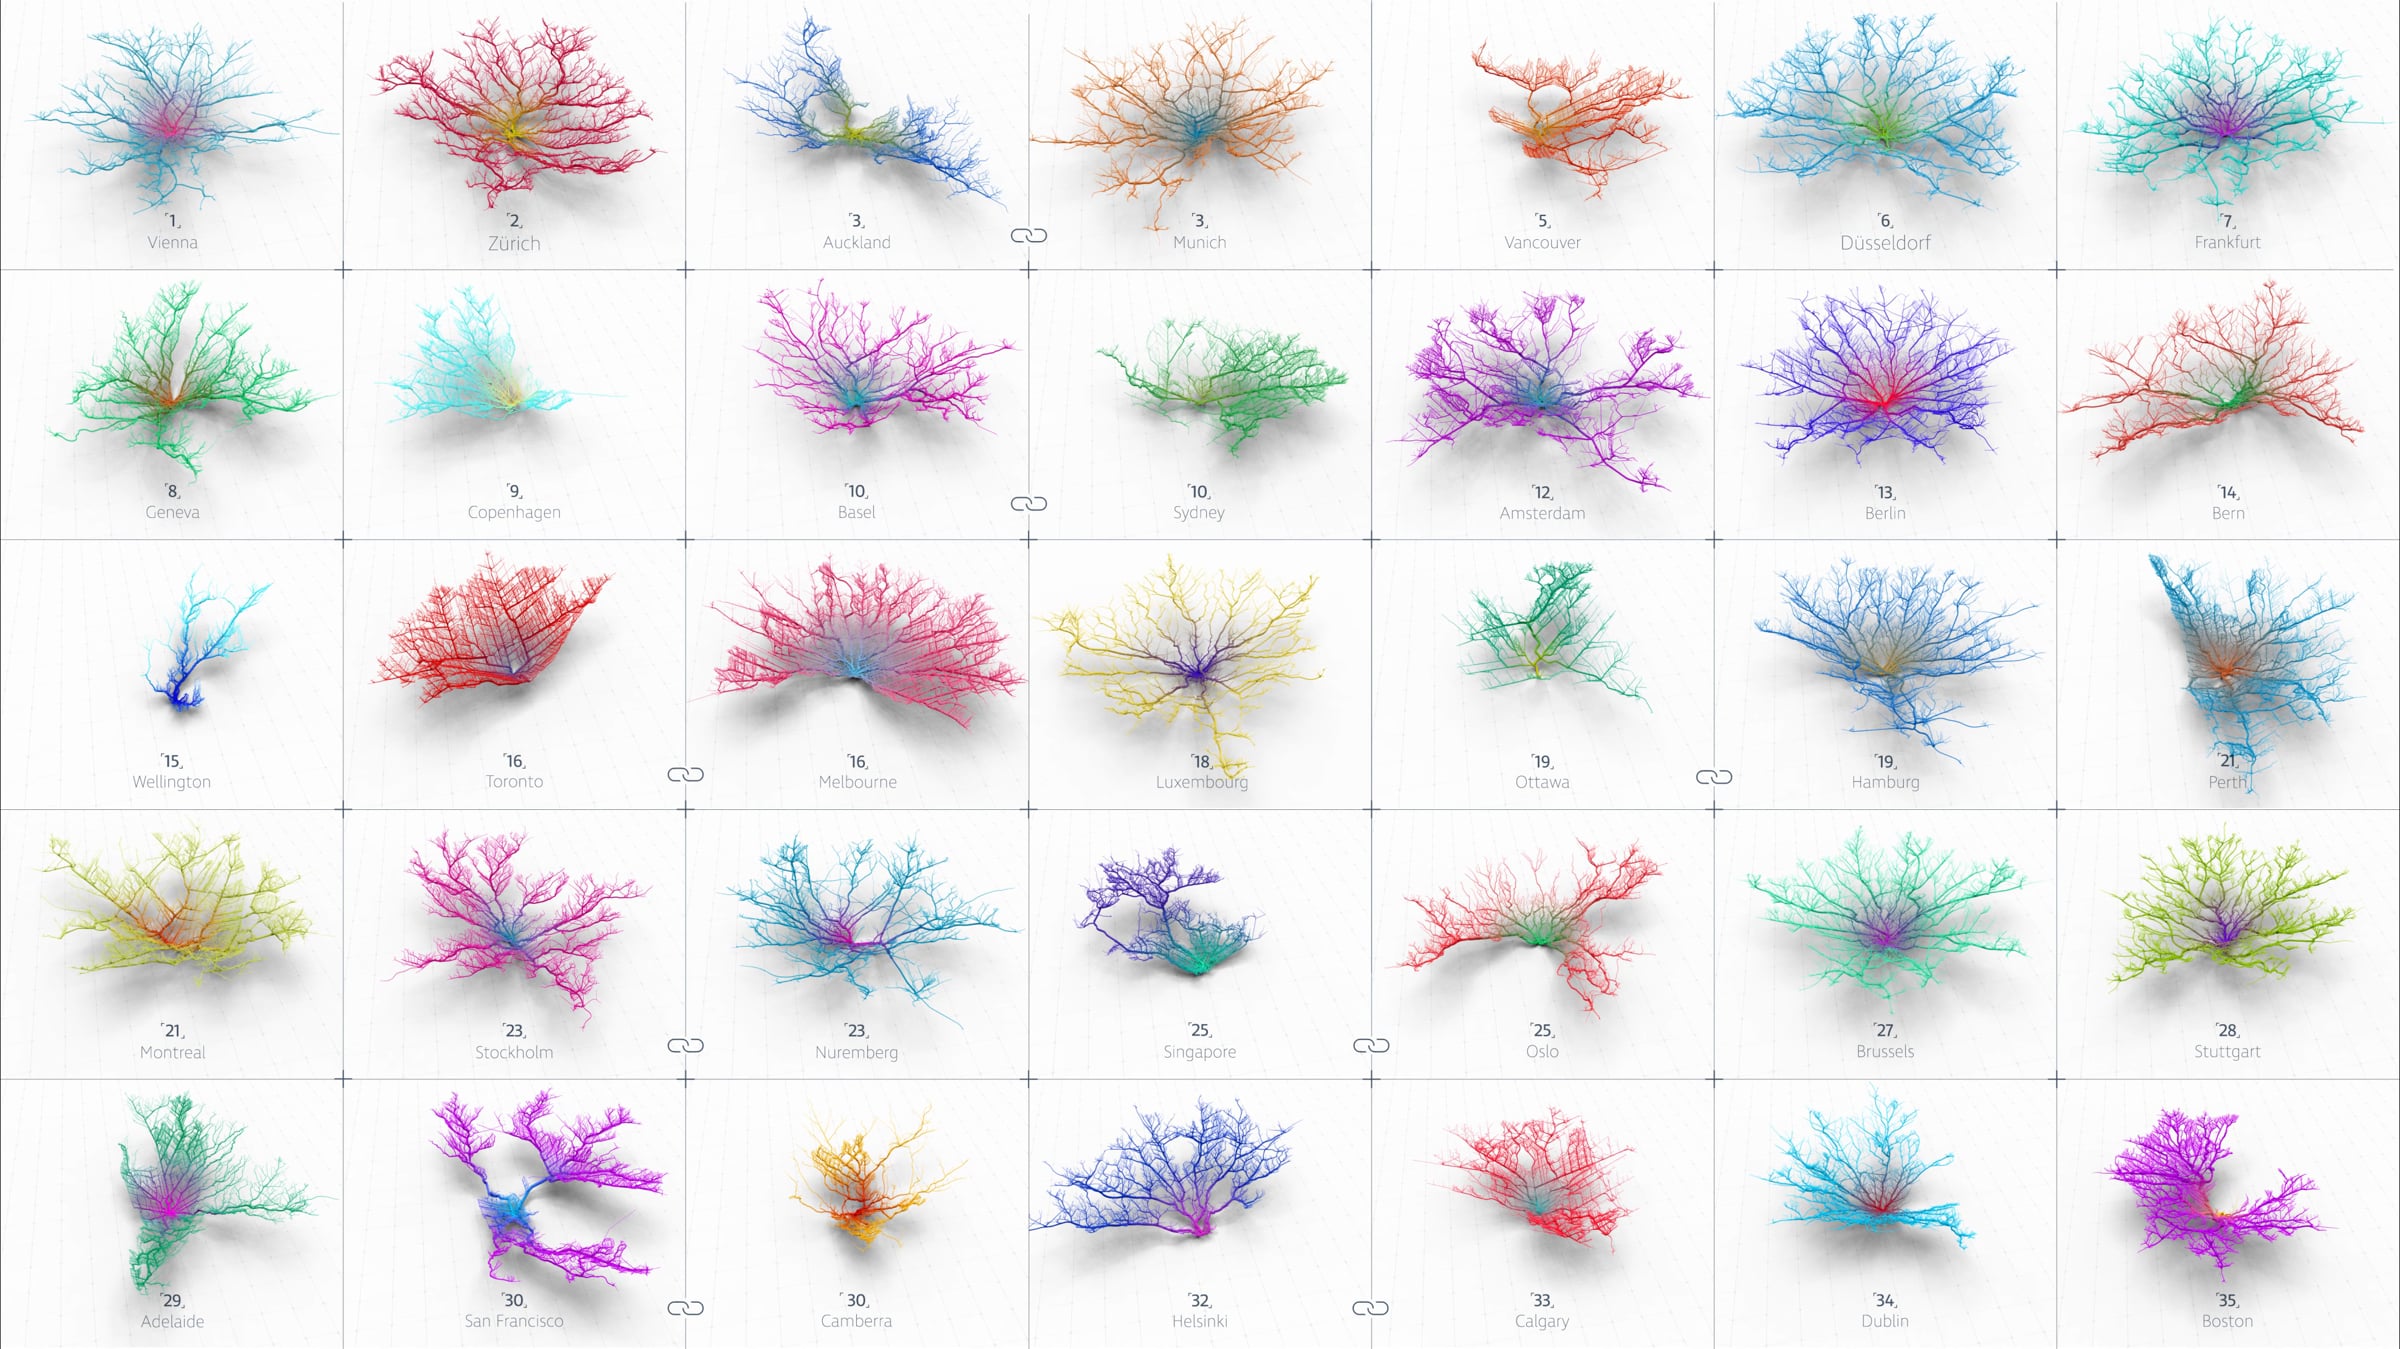
What makes a great city? Is it political stability? Low crime rates? Access to education or healthcare? We took one metric, looking at how easy it is for people to move within cities. We calculated how far you can travel (by car) from each city centre, in 30 minutes. The resulting ‘coral formations’ show transport data in a new way, revealing beautiful, organic forms. Each strand shows the arteries of a city, representing a possible route from the centre.
We applied this technique to each of the top 40 cities in Mercer’s Quality of Living City Ranking. The result is a unique perspective on how we move around some of the world’s greatest cities.
Visualised by the Ito World Design Lab (www.itoworld.com)
Map Data: © OpenStreetMap Contributors
Rank Data: Mercer Quality of Living Ranking https://www.mercer.com/newsroom/2018-quality-of-living-survey.html
Get started for free
24/7 customer support
Our customer support team is available to help 24/7. Enterprise members also receive dedicated account managers and a guaranteed uptime SLA.
© 2026 Vimeo.com, Inc. All rights reserved.
TermsPrivacyYour Privacy ChoicesU.S State PrivacyCopyrightCookies