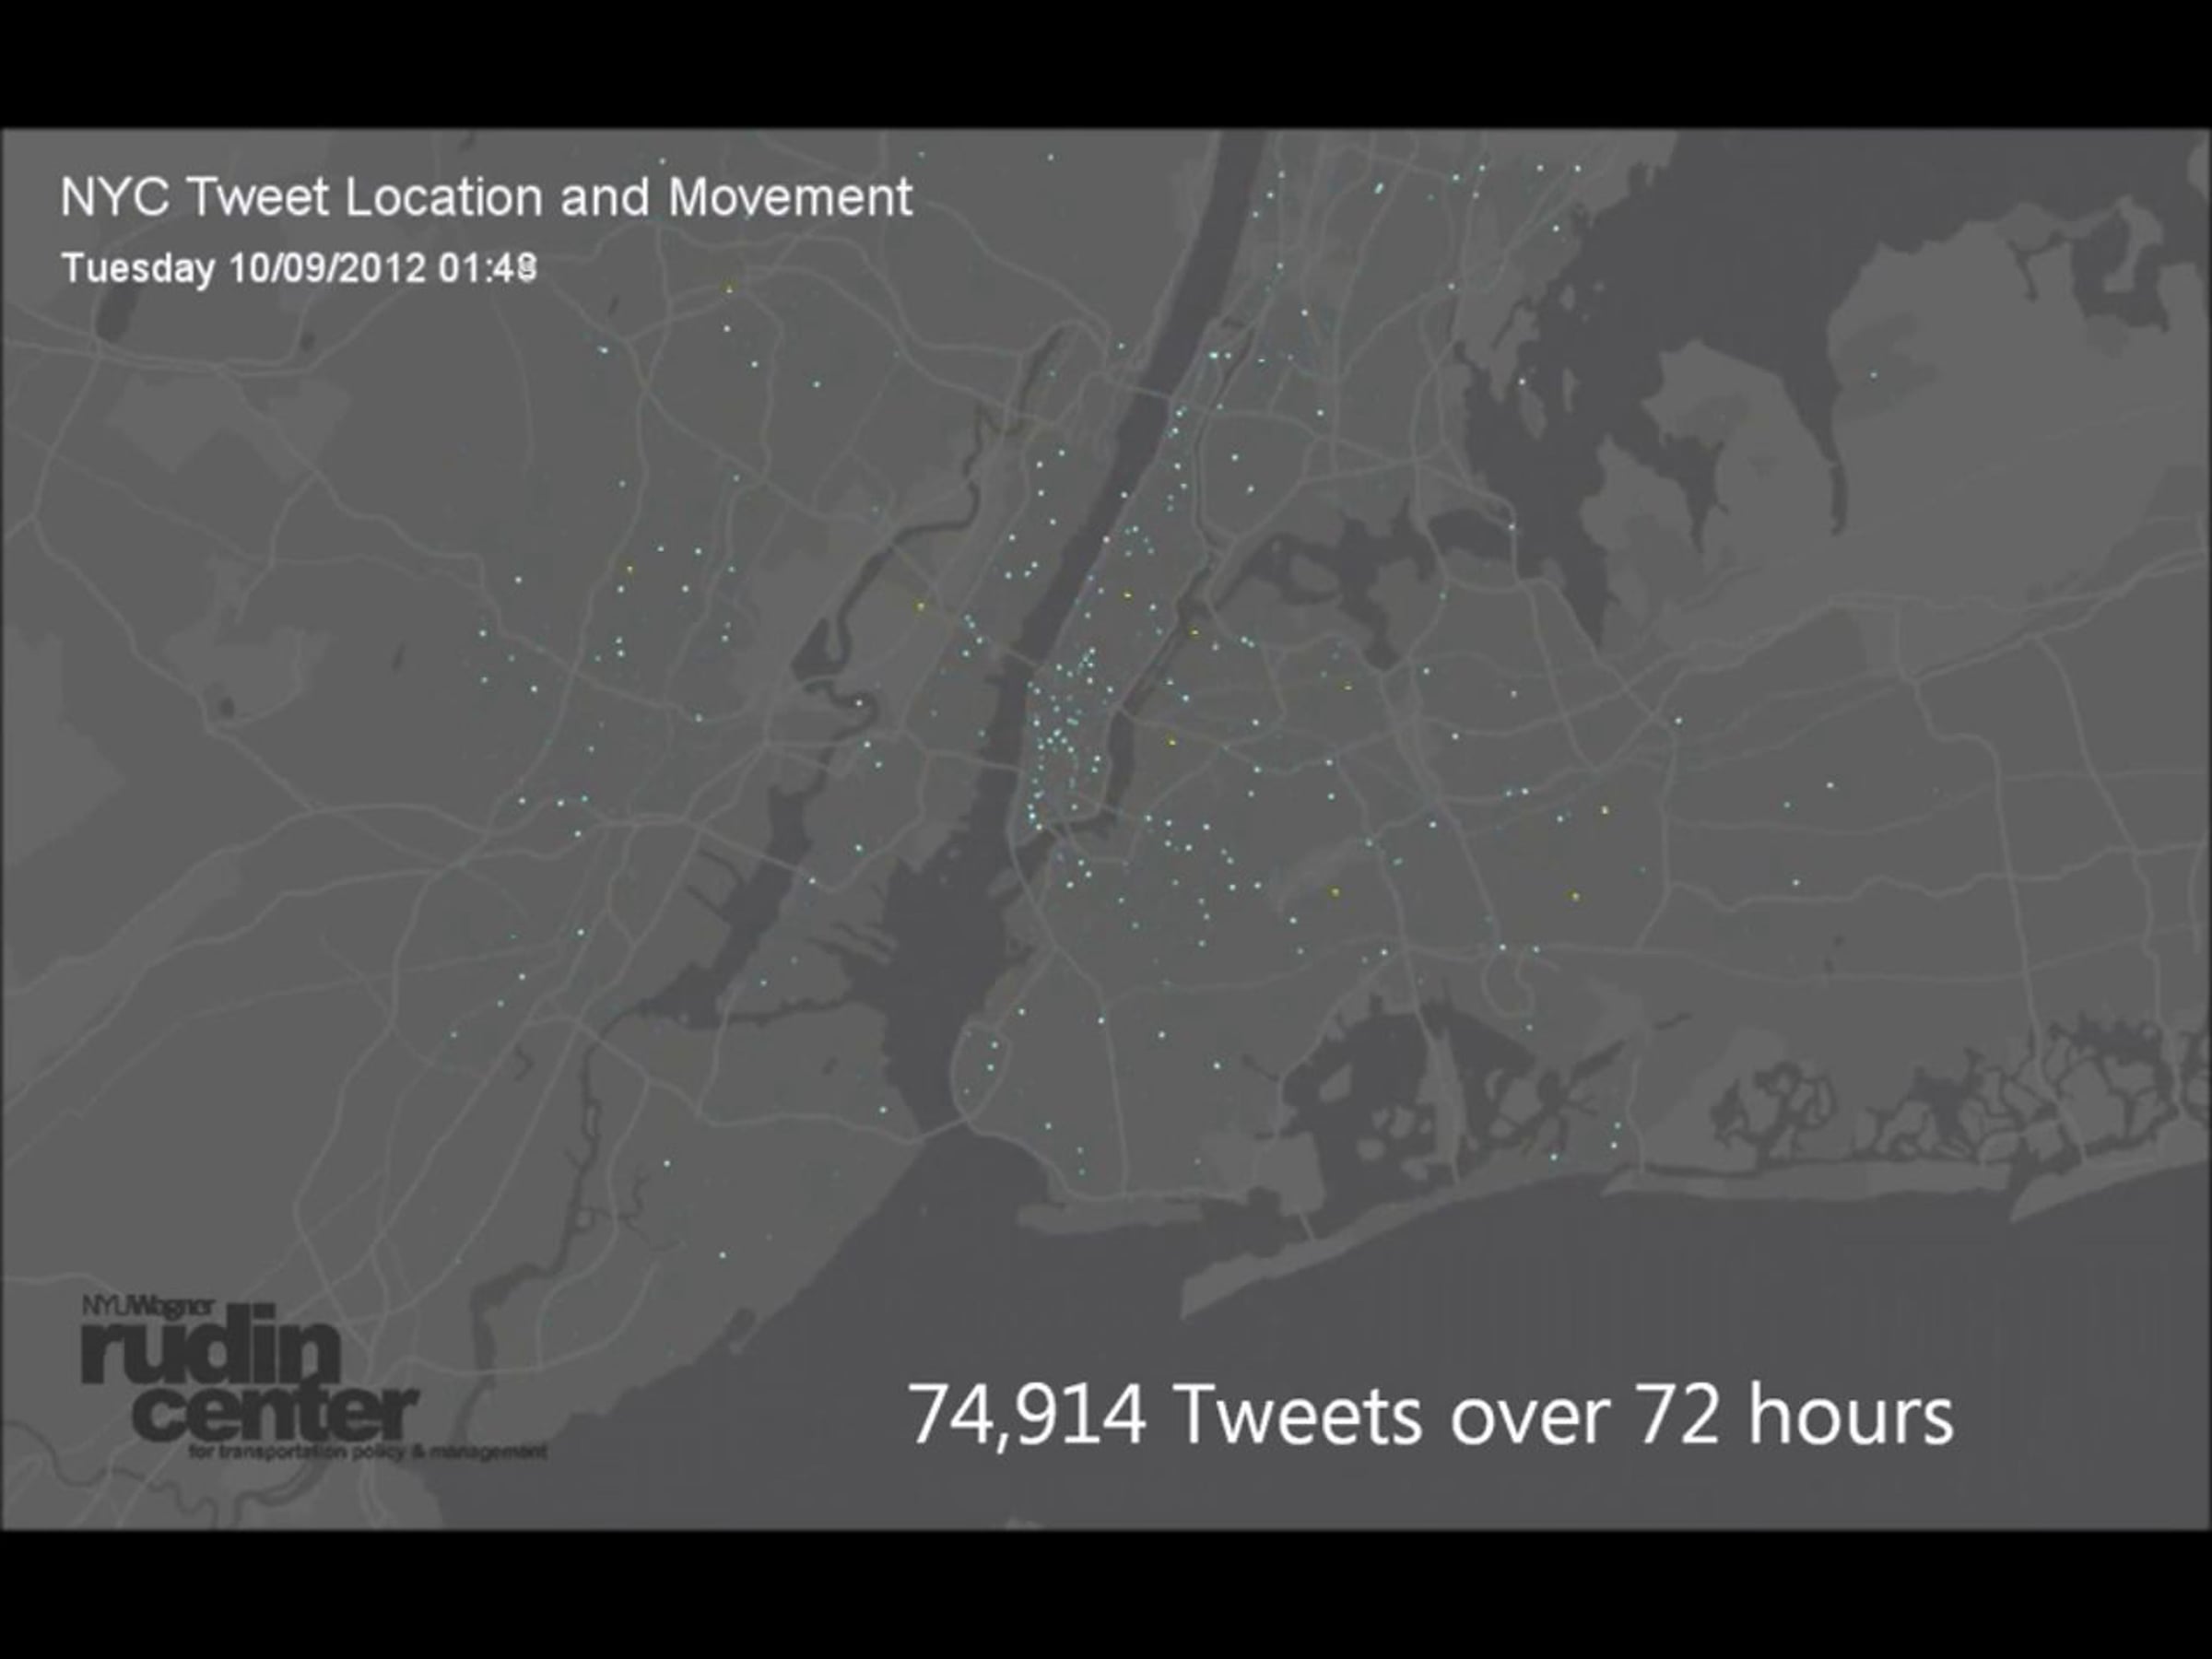
Animation - 3 Days of Geotagged Tweets

72 hours of geotagged tweets were logged using the twitter streaming API. Using processing, the tweet events are shown at the correct relative time and place using a blue dot. If the same user tweeted 2 or more times during the 72 hour period, their tweets will be connected in time and place with a yellow dot. Slow-moving and stationary yellow dots have been removed from the Animation to accentuate regional movement patterns.
Rush hour migrations into and out of the center city can be seen, as well as several other cross-borough movement patterns.
Get started for free
24/7 customer support
Our customer support team is available to help 24/7. Enterprise members also receive dedicated account managers and a guaranteed uptime SLA.
© 2026 Vimeo.com, Inc. All rights reserved.
TermsPrivacyYour Privacy ChoicesU.S State PrivacyCopyrightCookies