Solving SAP Org Charts & Org Design for a State Govt. Department.mp4

See a case study showing how Navigo helped a 40,000 employee Government Department visualise their SAP data in easy-to-use org charts. Plus, we’ll cover how org design tech helps with ‘future state’ structure using scenario testing, position impact reports & dashboards.
This webinar will cover:
- Initial project barriers & how we fix complex data issues
- A detailed walk through of the project
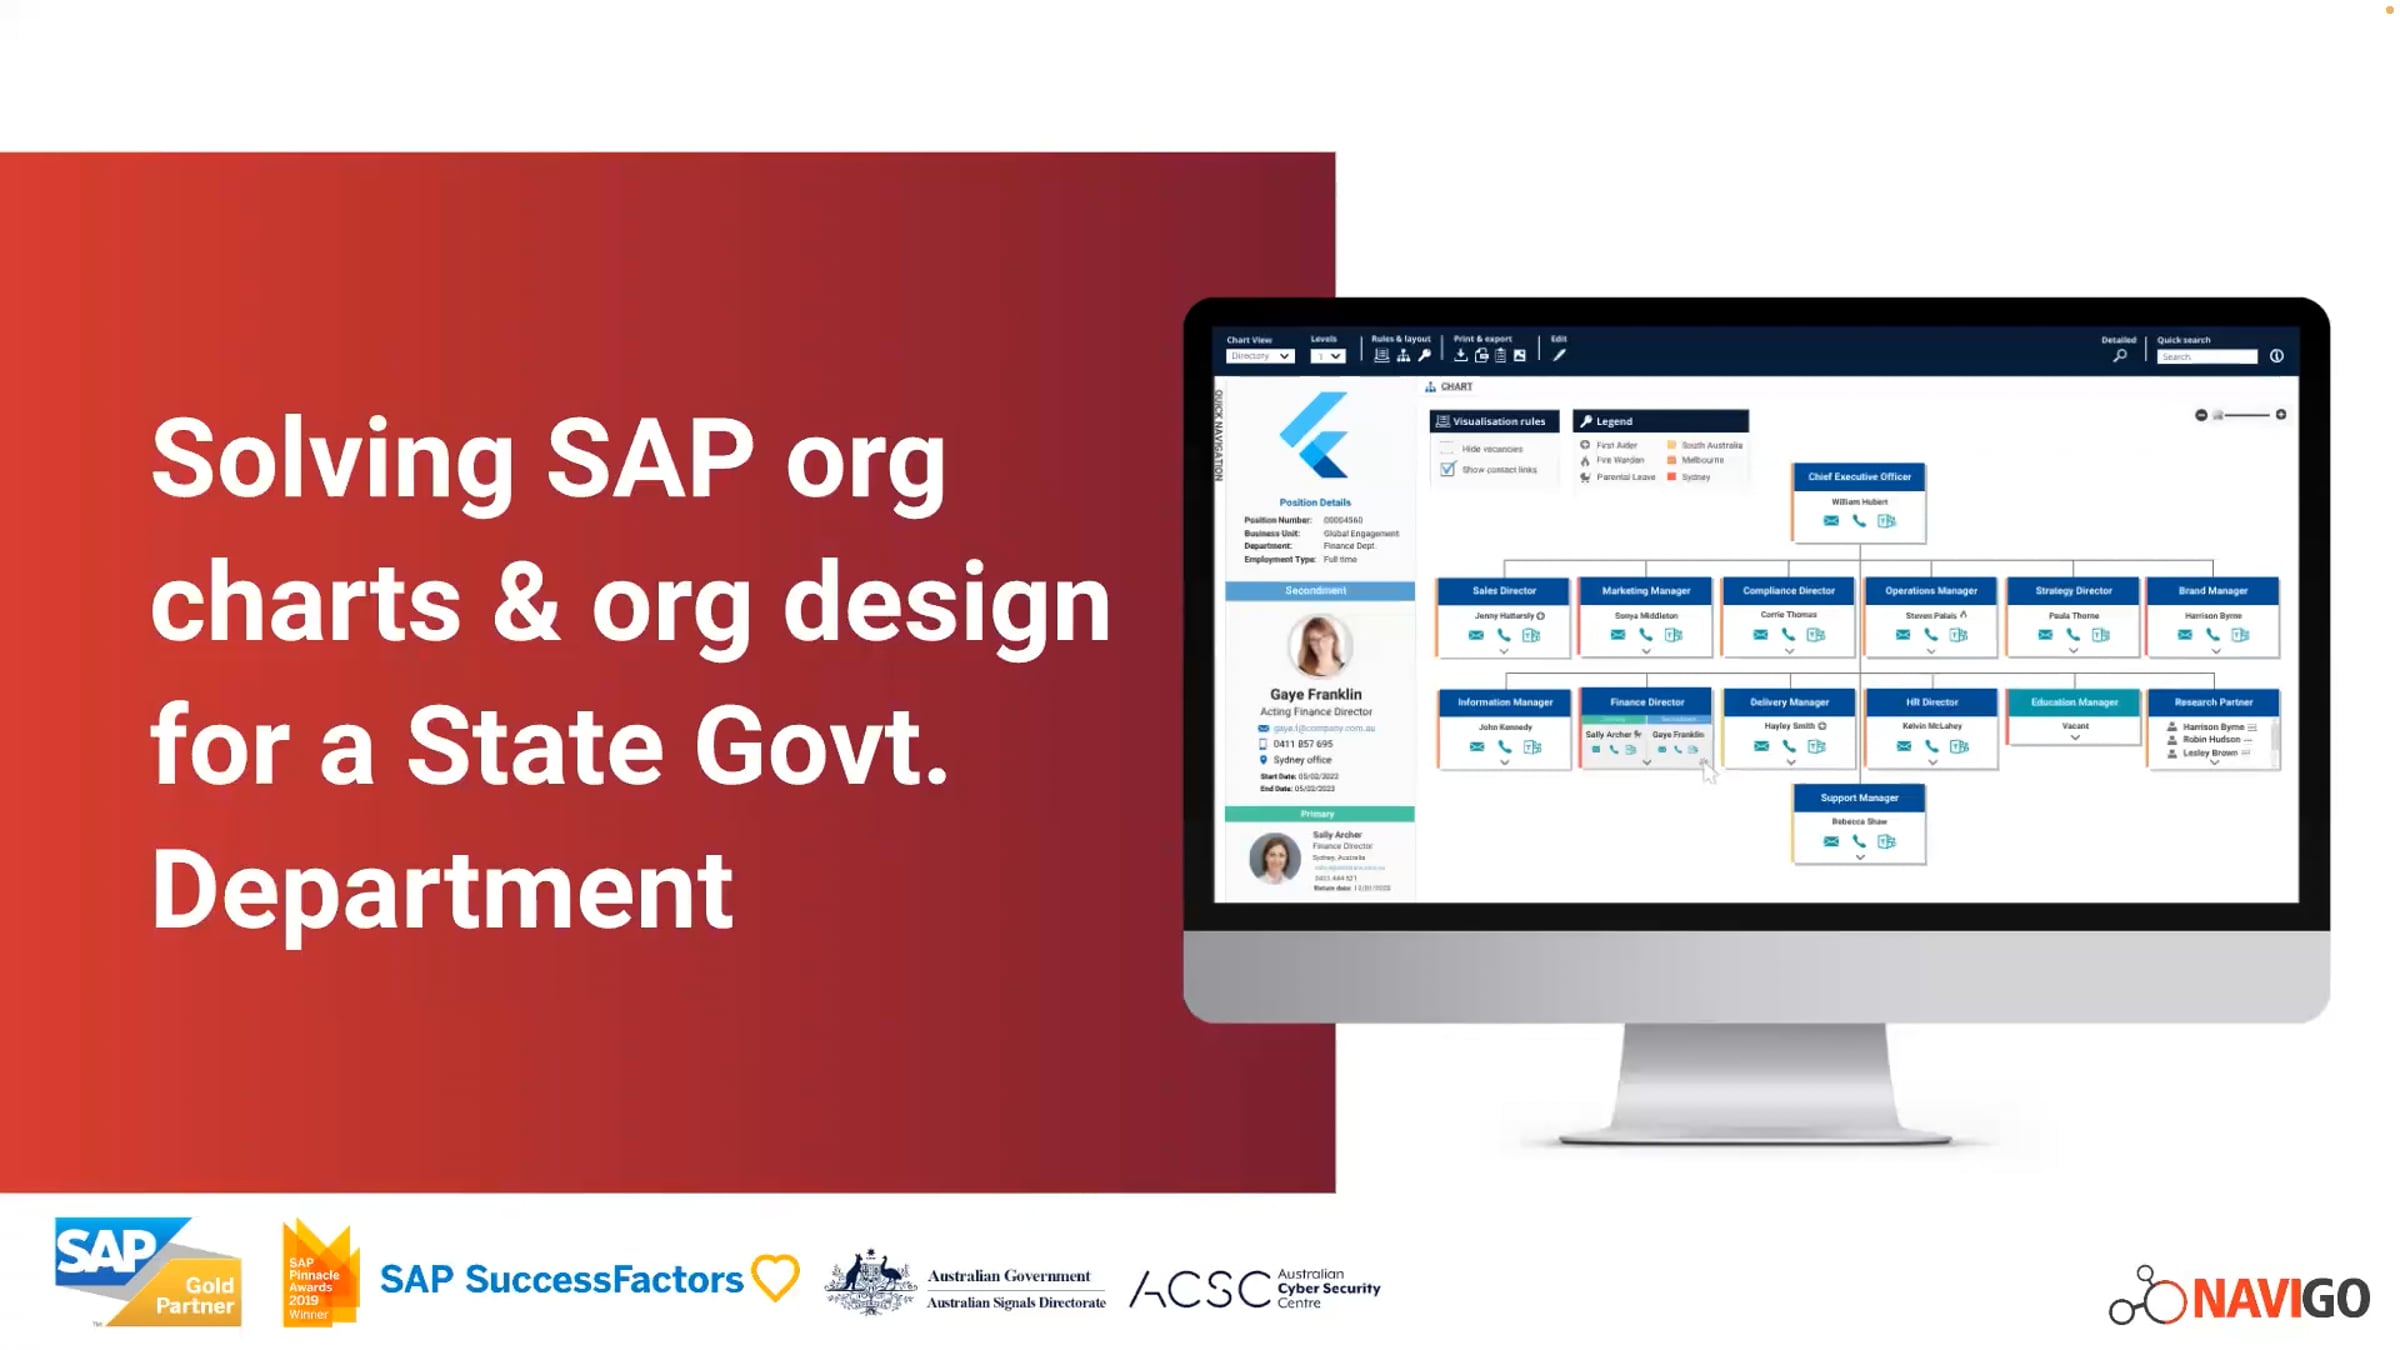
- Real-life examples of org charts & dashboards
- Impacts & outcomes for the business
Get started for free
24/7 customer support
Our customer support team is available to help 24/7. Enterprise members also receive dedicated account managers and a guaranteed uptime SLA.
© 2026 Vimeo.com, Inc. All rights reserved.
TermsPrivacyYour Privacy ChoicesU.S State PrivacyCopyrightCookies