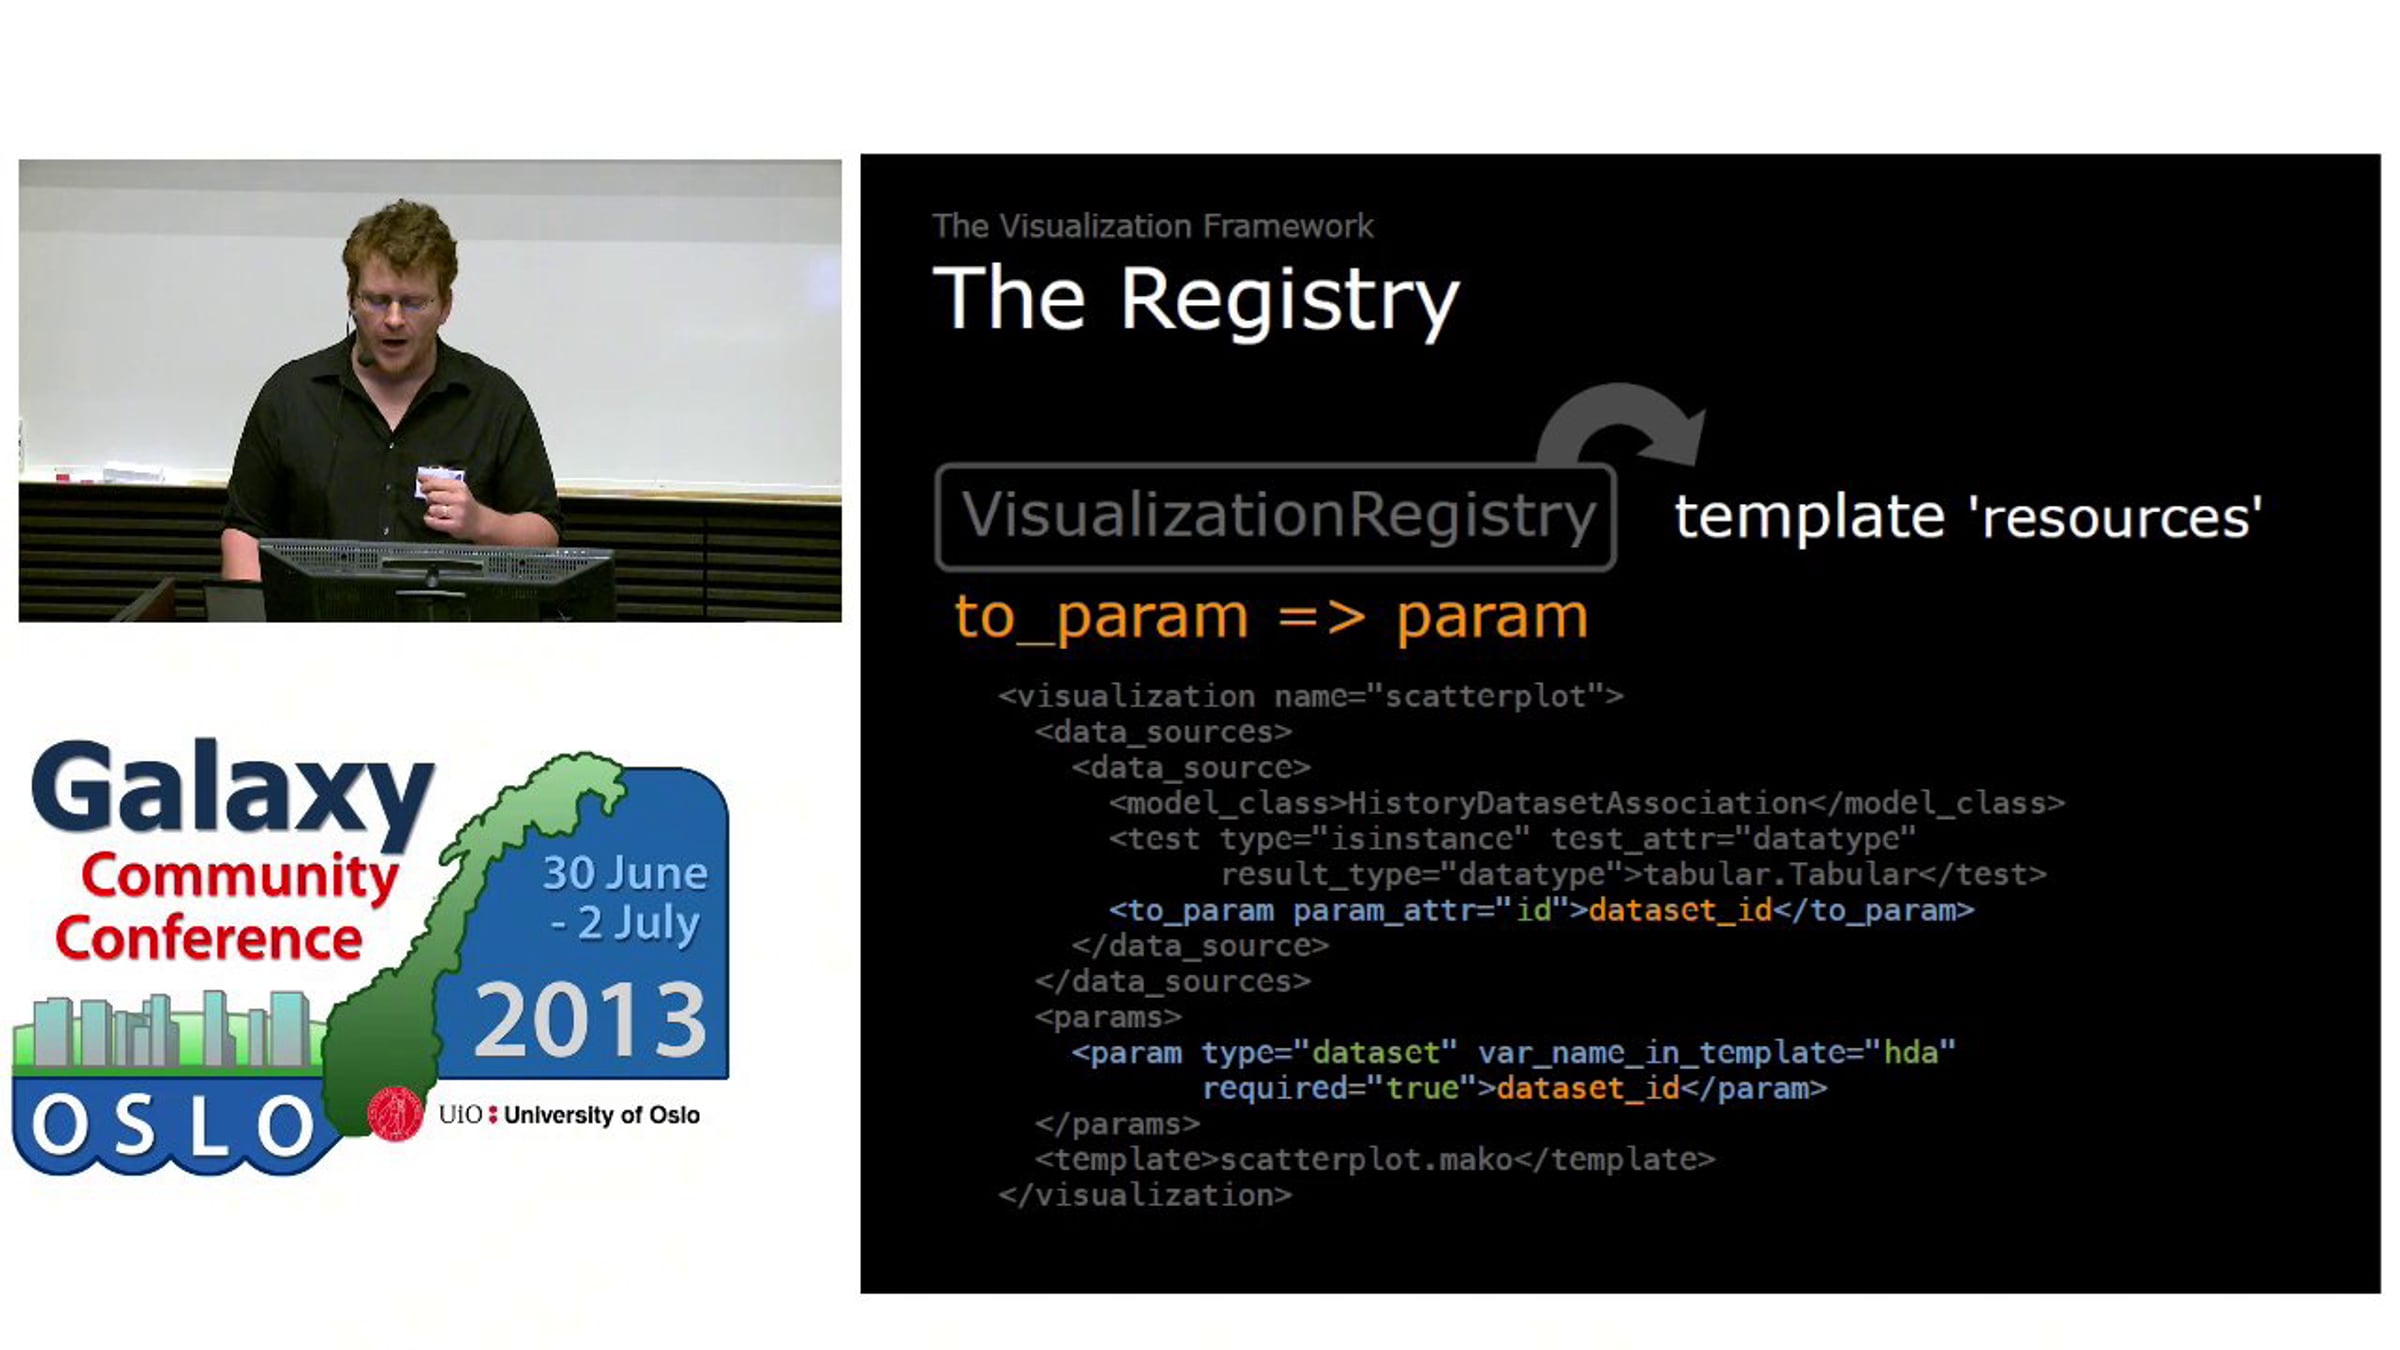
How to Create Your Own Web-based, Interactive Visualizations for Galaxy, presented by Carl Eberhard at GCC2013.

Carl Eberhard1, Jeremy Goecks1, The Galaxy Team1,2, Anton Nekrutenko2, and James Taylor1
1 Emory University
2 Penn State University
Visualization plays an integral role in scientific investigation. Visualization is useful for viewing large amounts of data simultaneously, observing patterns and outliers amongst data, and communicating findings to others. To make visualization easier and more powerful in Galaxy, we have create a framework for integrating Web-based visualizations into Galaxy. Just as tools can be easily added to Galaxy, visualizations can now be added as well. Visualizations can be easily accessed via an icon in the history panel’s stored datasets. Galaxy visualizations have many advantages: (i) they can be made highly interactive and customizable; (ii) they require no software or data downloads, and (iii) they can be saved, shared via URL, and included in Galaxy Pages—and shared/included visualization are fully interactive.
In this talk, we describe how to create your own visualization for Galaxy. We provide an overview of how to query datasets in Galaxy for both aggregate data as well as individual data points and how to add a data provider for your own data type. Galaxy includes data providers for SAM/BAM, BED, Interval, GFF/GTF, VCF, BedGraph, Wiggle, and BigWig/BigBed. We also discuss Galaxy JavaScript libraries that can be used to create Web-based visualizations. These libraries include support for creating and saving visualizations, for querying and caching data from Galaxy datasets, and for working with Galaxy tools and genome data. Finally, we introduce an XML data format for configuring a visualization to work with Galaxy.
See http://bit.ly/17rblfK.
Get started for free
24/7 customer support
Our customer support team is available to help 24/7. Enterprise members also receive dedicated account managers and a guaranteed uptime SLA.
© 2026 Vimeo.com, Inc. All rights reserved.
TermsPrivacyYour Privacy ChoicesU.S State PrivacyCopyrightCookies