
-
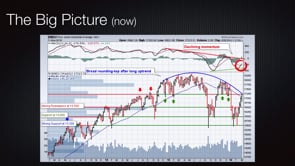
Martin Pring's Market Round-Up LIVE! - 2016-03-15 17:00
-
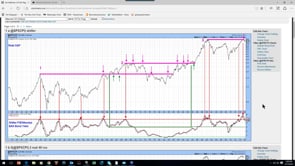
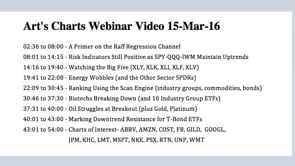
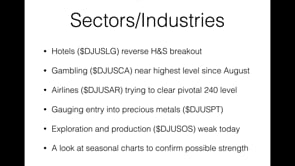
"Art's Charts LIVE!" with Arthur Hill - 2016-03-15 13:00
-
Trading Places LIVE! with Tom Bowley - Monday Edition - 2016-03-14 12:00
-
"ChartWatchers LIVE!" with Chip Anderson - 2016-03-12 13:00
-
"The DecisionPoint Report" with Erin Heim - Friday Edition - 2016-03-11 19:00
-
Trading Places LIVE! with Tom Bowley - Friday Edition - 2016-03-11 12:00
-
"Commodities Countdown LIVE!" with Greg Schnell - 2016-03-10 17:00
-
"The DecisionPoint Report" with Erin Heim - Wednesday Edition - 2016-03-09 19:00

Channels are a simple, beautiful way to showcase and watch videos. Browse more Channels.