Real-time live stream analytics you can act on mid-broadcast
You're in great company
Flying blind during a live event costs you the audience
- Analytics show up hours after the stream ends
Post-event dashboards tell you what already happened. By the time you see the drop-off spike, the audience is gone and the recording is already replaying the same weak spot.
- You can't tell if the audience is with you
Without a live dashboard, the presenter reads the chat and guesses. Chat is a proxy for engagement, not the whole picture: viewers, geography, and drop-off all matter.
- Simulcast destinations each report differently
When you're streaming to YouTube, LinkedIn, and Facebook at once, each platform reports its own numbers in its own dashboard. Nobody has a single live view of total reach.
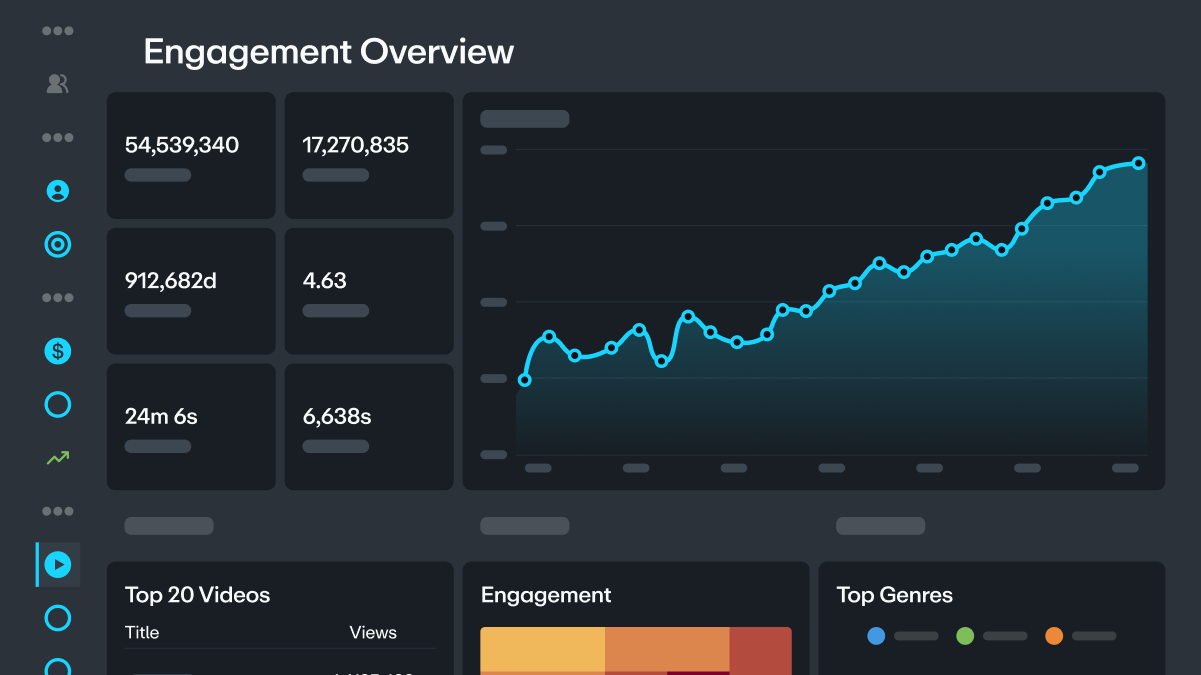
Watch your live stream's audience move in real time
Concurrent viewer count
Geographic distribution
Engagement signals
Stream health monitoring
Use live analytics to reshape the broadcast while it's happening
Adjust pacing mid-stream
Take Q&A early when engagement peaks
Extend when the audience is there
Simulcast across destinations
Trusted by marketers, businesses, and video pros around the globe
- 100+ billion
video views (and counting)
- 7+ million
videos uploaded every month
- 4+ billion
minutes streamed each month
Why real-time live stream analytics change how a broadcast runs
In-flight decisions, not post-mortems
The producer adjusts run-of-show based on live audience data instead of learning the same lessons two hours after the stream ends.Presenter confidence
The presenter sees engagement climb during a strong segment, which reinforces the delivery. Real-time confirmation is worth more than a post-event report.Moderator prioritization
The moderator sees which questions get upvoted and which regions are asking, and surfaces the ones that map to the audience actually watching.Technical safety net
Stream health metrics catch a bitrate dip or an encoder issue before the audience sees a stall. Enterprise backup streams switch over automatically.Simulcast in one view
Total reach across YouTube, LinkedIn, Facebook, and RTMP destinations aggregates into one concurrent count. No tab-switching between platform dashboards.Audience-informed content decisions
Which segments held the audience, which lost it, and which drove Q&A shape the next stream's content plan directly, without guesswork from chat.
Registration-to-viewer conversion
Registration data flows into the same dashboard, so the live view shows how many registrants actually showed up and how they behaved.CRM sync
Viewer, registrant, and engagement data sync into HubSpot, Marketo, or Salesforce so the sales and marketing teams see live event behavior in the CRM.Post-event recording ready fast
The recording auto-captions post-event so the on-demand replay ships within hours, capturing viewers who missed the live window.
How to run a live stream with real-time analytics on Vimeo
Step 1
Set up a live event in your Vimeo workspace on a plan that includes live streaming (Advanced and Enterprise). Configure registration, simulcast destinations, and any audience engagement tools.Step 2
Connect your encoder, camera, or web-based studio input. Test the stream ahead of go-live and confirm the health metrics show green across bitrate and ingest.Step 3
Open the live event dashboard in a second window or on a producer machine. Concurrent viewers, geography, chat, and Q&A metrics stream in as the broadcast starts.Step 4
Adjust in-flight. Signal pacing changes to the presenter, surface high-engagement questions to the moderator, and watch stream health alongside audience metrics.Step 5
End the stream, review the post-event analytics against your real-time notes, and publish the auto-captioned recording for on-demand viewing within hours.
Find the right plan for you
Vimeo offers discounts to US-based non-profit organizations and educational institutions. Learn more.
For more information on feature availability, please reference our pricing page.
Frequently asked questions about real-time live stream analytics
- Monetize Your Website With Video Subscriptions With Vimeo
- MOV to MP4 Converter Online, Free With Vimeo
- MP4 Video Player, Fast and Ad-Free With Vimeo
- Multi-Camera Live Streaming Software With Encoder Support With Vimeo
- Organization-Wide Custom Metadata for Video Review With Vimeo
- Private Review Links for Agencies and Producers With Vimeo
- Private Video Hosting Built for Real Security With Vimeo
- Product Demo Video Maker With Recording and Editing With Vimeo
- Replace Video Files Without Breaking URLs or Embeds With Vimeo