Video engagement analytics that show what actually worked
You're in great company
Video view counts do not tell you which videos actually convinced anyone
- Views without watch time
A view count says the video started. It does not say whether the viewer stayed for the pricing slide, skipped the intro, or bounced at the demo. The number that gets celebrated is the number that hides the answer.
- No line from engagement to pipeline
The marketing team sees plays in the video tool and leads in the CRM, but the connection between the two lives in spreadsheets, if it exists at all. High-engagement viewers stay invisible.
- One dashboard per platform, five platforms
Video engagement sits in the hosting tool, form submissions in the marketing platform, revenue in the CRM, and traffic in GA4. Rolling them up for a QBR is a weekend of exports.
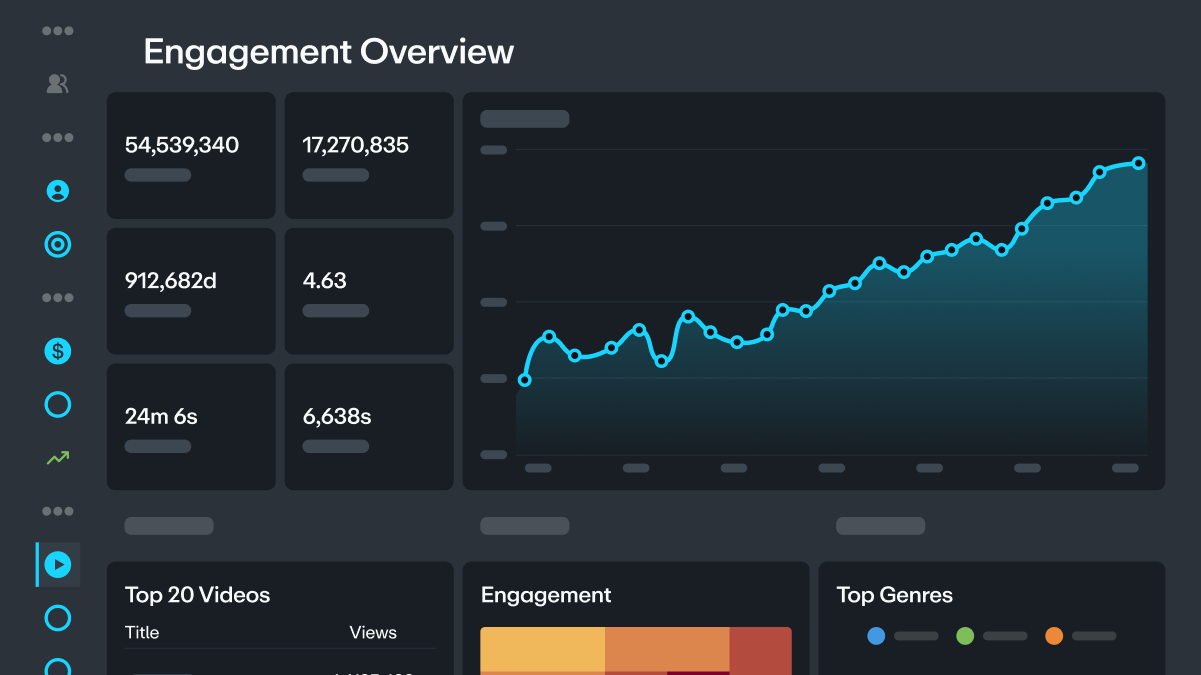
Read every engagement signal for your video in one dashboard
Second-by-second retention
Engagement heatmaps
Embed-source tracking
Geography down to city
Sync video engagement to HubSpot, Marketo, and Salesforce
HubSpot and Marketo integrations
Salesforce CRM sync
GA4 integration
Analytics API for BI tools
Trusted by marketers, businesses, and video pros around the globe
- 100+ billion
video views (and counting)
- 7+ million
videos uploaded every month
- 4+ billion
minutes streamed each month
What the marketing team does with video engagement analytics that actually work
Optimize the drop-off point
The retention curve tells you where viewers leave. Trim the intro, rework the section they skip, and reupload with the same URL. Iteration happens with a signal, not a hunch.Score leads by engagement
A viewer who finishes your demo is a hotter lead than a form fill. Send engagement scoring into HubSpot or Marketo and the sales team calls the right prospects first.Attribute plays to channels
Embed-source tracking shows which channels and landing pages drove the most engaged plays. The next quarter's channel mix reflects what worked, not what looked busy.Compare video performance
Stack retention and completion side by side across a video library. The formats and topics that hold attention become the template for the next production cycle.Track team viewing for required content
For compliance training or internal comms, see which employees watched required videos to completion. The report goes to the L&D or comms team without a manual chase.Real-time event analytics
For webinars and live events, watch concurrent viewers and engagement in real time during the broadcast. Adjust the run of show if attention slips mid-event.
Geographic targeting for translations
City-level geography tells you which regions justify translated captions or a full AI dub. Localize where the audience actually is, not where it might theoretically be.Export to CSV for QBR
Filter engagement by date range, embed source, or campaign, and export to CSV. The video slice of the QBR deck writes itself from one dashboard rather than five.Viewer-level data on Premium and Enterprise
Premium and Enterprise plans expose per-viewer analytics tied to email address. For gated content, the marketing team sees exactly who watched, how far, and when.
How to read video engagement analytics on Vimeo
Step 1
Open a video from your Vimeo workspace and click the Stats tab. Set the date range for the campaign window or since publish. The dashboard loads views, watch time, and finish rate.Step 2
Scroll to the retention curve. Identify the seconds where drop-off spikes. Layer the engagement heatmap to see which moments viewers rewatch, pause, or skip.Step 3
Filter by embed source to see which landing pages, campaigns, or partner sites drove the most engaged plays. Check geography for regional performance.Step 4
Connect HubSpot, Marketo, or Salesforce so engagement data syncs to contact records. Set up scoring rules that fire when a prospect passes a watch-time threshold.Step 5
Export the report to CSV for the QBR, or pipe the Analytics API into Tableau, PowerBI, or Looker for cross-channel rollups alongside the rest of marketing performance.
Find the right plan for you
Vimeo offers discounts to US-based non-profit organizations and educational institutions. Learn more.
For more information on feature availability, please reference our pricing page.
Frequently asked questions about video engagement analytics
- Sell Stock Video With 90% Revenue Share With Vimeo
- Sell Videos Online With Pay-Per-View With Vimeo
- Simulcast to YouTube, Facebook, and LinkedIn With Vimeo
- Simulive and Scheduled Streams That Feel Live With Vimeo
- Stream Live Events With Production and Audience Tools With Vimeo
- AI Subtitle Generator in 99 Languages With Vimeo
- Summarize YouTube Video With AI With Vimeo
- Time-Coded Video Feedback and Comments With Vimeo
- Training Video Software With LMS Embeds With Vimeo